Yes, you are right! We have to provide a Model/view architecture!
And I didn't understand about your QtCharts object ?
About Data, a first approch is to split Uni-dimensional Data and Bi-Dimensionsal. And use QVariant as variable.
Exemple : Bidimensional
QChartData data;
data.add("jan", 23);
data.add("Feb", 32.3);
data.add("Mar", 14);
data.xAxis().setLabel("Month");
data.yAxis().setLabel("temperature);
Or : Unidimensional
QChartData data;
data.add("2");
data.add("4");
data.add("5");
data.add("6");
The question is : Do we have to provide the same Object for uni et bi dimensionnal ?
And what about Multi dimensional data ?
About display :
I agree with marc! Create a QPainter Layout and on the top, create Many QGraphicsItem.
So , The chat room is open on : irc.freenode.org #qtcharts
I m currently looking other API language.
You are all welcome to help us in this project!
Added after 4 minutes:
I just found this documentation ! It sounds great! Can be an example for qtcharts!

look the documentation here :
http://approximatrix.com/products/op...eloper-s-guide
Added after 29 minutes:
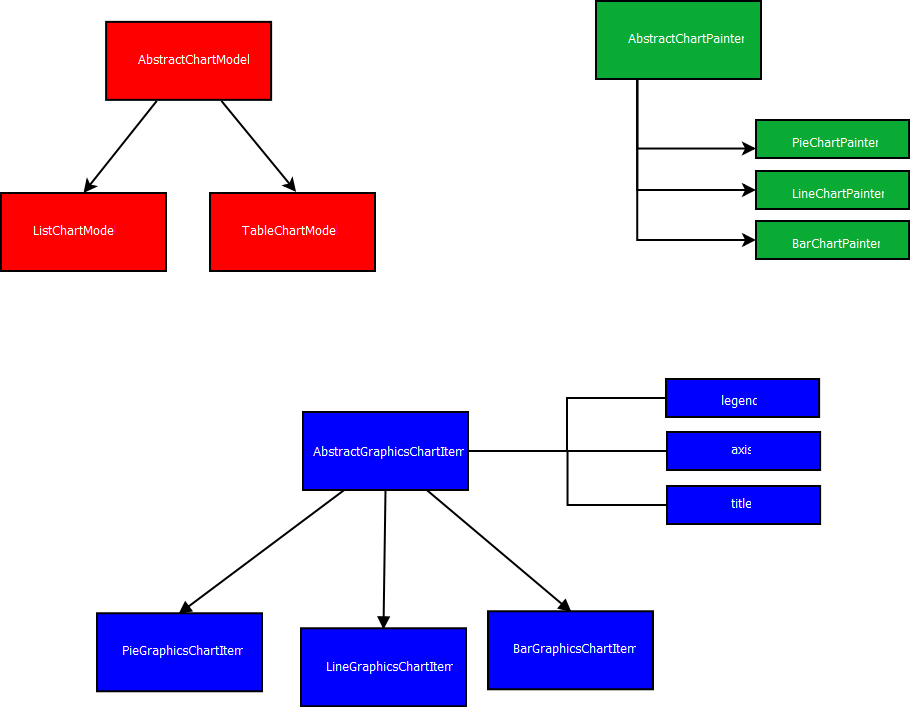
Here is a quickly preview ! It may be change ofcourse!
Added after 9 minutes:
How does it work :
QListChartModel * model = new QListChartModel;
model->setTitle("title");
model->addData("30", "20", "50");
model->setLabel("red", "green","blue");
QPieGraphicsChartItem * item = new QPieGraphicsChartItem;
item->setModel(model);
item->setBackgroundColor(Qt::white);
item->setColor("red", Qt::Red);
scene->addItem(item);
view->show();
QListChartModel * model = new QListChartModel;
model->setTitle("title");
model->addData("30", "20", "50");
model->setLabel("red", "green","blue");

QPieGraphicsChartItem * item = new QPieGraphicsChartItem;
item->setModel(model);
item->setBackgroundColor(Qt::white);
item->setColor("red", Qt::Red);

QGraphicsView * view = new QGraphicsView;
QGraphicsScene * scene = new QGraphicsScene(view);

scene->addItem(item);
view->show();
To copy to clipboard, switch view to plain text mode


 Reply With Quote


 Try again
Bookmarks